// Twitter Cards // Prexisting Head The Biologist Is In: 2017

Tuesday, October 31, 2017

Sex Chromosomes of the Triturus Newt

Salamanders and newts are an interesting group of animals. They're amphibians, like the frogs and toads you're probably familiar with, but they have an elongated body form that looks more like a lizard. They're generally rather small and tend to live in places where you don't, so you probably won't see one unless you go a bit out of your way in search of them. Both salamanders and newts start out life as a submerged egg that hatches into a swimming tadpole. As they grow up, they both generally metamorphose into a form adapted for crawling around on land (though they do prefer moist places). Salamanders typically live out the rest of their lives in this stage, while newts return to an aquatic life once they reach full maturity. Adult newts develop a flattened tail that helps them swim and then they go about their quiet lives underwater.

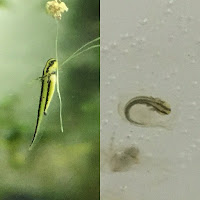
Figure illustrating relationships between species in genus Triturus, with two representative salamanders at right.
Fig1. Adapted from Grossen et al. and photos by @Blackmudpuppy.
Hidden within these shy critters is some really interesting biology. One group, the Triturus newts (the marbled and crested newts), have some peculiar chromosome weirdness going on that results in the death of 50% of their eggs. Evolutionarily, this is a very strange situation. You'd expect any trait that resulted in such a high rate of offspring loss would quickly disappear from a population. You definitely wouldn't expect the trait to become a permanent fixture of most species in the genus, as is observed.


Two very young juvenile newts, with dark body stripes and long extended gills.
Fig 2. Triturus babies.
Photos by @Blackmudpuppy
My initial thought was that maybe the dead eggs were fed upon by their surviving siblings. Kin selection could then explain why such an apparently "wasteful" trait would stick around. If the additional nutrition gained from eating a sibling resulted in at least a 2x increase in genetic fitness (survival and offspring), then the trait could be maintained by this mechanism.

The problem with this idea is that the newts lay their eggs individually, folding a bit of underwater leaf over them for protection from predators. Any given hatchling wouldn't be expected to find a separately stashed egg, so the dead eggs would probably be consumed by other organisms. If the eggs were laid in small clusters, the story might be different, but for now we have to abandon this hypothesis.


Fig 3. Hypothetical lethal male.
The next thought I had is about the 50% loss. That specific number implies a limited set of possible genetics patterns. The first I thought of is the way our biology (generally) uses chromosomes to determine our sex. The male gametes come in X and Y versions, while the female gametes are all X. The result is that 50% of our kids are XX and 50% are XY. (There are lots of subtleties and complications to this story, but for now I'm just going to use this simple model.) If the Triturus newts were doing basically this (without the sex-determination thing the way we do it), but one version of the sperm always resulted in dead embryos... Well, that chromosome would very quickly disappear from a population. This is another hypothesis we have to abandon.

Fig 4. Balanced lethal chr1 in Triturus.
At this point I dug up a 2012 paper by Grossen et al., which described what was going on and described a model for how it might have come to be. It turns out every one of these newts has two distinct versions of their chromosome 1 (the largest chromosome). The two versions have a region of sequence with inversions and deletions relative to the other. These differences mean the two regions don't recombine during meiosis like the comparable regions of most chromosomes. This is significant because each version of this region has a recessive lethal allele that is paired to a functional allele on the other version. (Probably some of those deletions I mentioned earlier.) If any egg is fertilized with a sperm carrying the same version of this chromosome, one of the recessive lethal traits is expressed. This results in the death of 50% of embryos, and leaves the survivors all heterozygous for chromosome 1. This is a pattern that can continue through generations.


The difficulty arises when we consider how this arrangement could come to be. If either recessive lethal allele was present without the other, then it would be selected out of the population. The chromosome version without a lethal allele would quickly dominate in the population (and we wouldn't see a 50% death rate among the babies).

The Grossen et al. paper goes into some really cool details about how sex-determination works in these newts. They have an XY sex-chromosome system kind of like ours, but they're also strongly impacted by temperature. If baby newts are raised up in water that's too warm, they'll become functionally male. If they're raised up in water that's too cold, they'll become functionally female. If the temperatures are extreme enough, they'll all grow into one sex without respect to what their sex-chromosomes look like. (This happens with lots of cold-blooded creatures, though what sex is produced at what temperature varies by species.)

In this context, they propose that the 1a/1b chromosomes that are causing so much trouble started out as two versions of an ancestral Y-chromosome. Y-chromosomes tend to collect recessive lethal mutations (deletions and such) and different lineages of Y-chromosome will end up with different mutations. If a population of ancestral Triturus newts experienced a significant cold spell, some of the chromosomally male newts would have grown up female. They could then breed with more typical males to produce offspring with two Y-chromosomes. If the two Y-chromosomes have the same mutations, the offspring would die. But if they had sufficiently different versions, they could survive. (This has been shown experimentally in a few species, as described in Haskins et al. 1970.) Grossen et al. go into some detail simulating how this initial case could lead to the chromosome dynamics now seen.


Fig 5. Model for evolution of
balanced lethal Ys.
While I was reading the Grossen et al. paper, I was thinking of a slightly different version of the model. In this version, we see a female-promoting mutation develop instead of the male-promoting one that was modeled. In the associated figures to the right, I've included Punnett squares for all the possible chromosome combinations involved in matings at each stage of the model. The color of the progeny squares represents their sex, as determined by the interaction between genetics and temperature. (Red=female; blue=male; purple=either; black=dead.)
  1. The population beings with XY males and XX females. Multiple Y lineages coexist.
  2. As the temperature drops, the offspring of all XY*XX crosses develop as female. Sooner or later a XY female of the newer generation meets up with an XY male from the previous generation. If the Y-chromosome versions are the same, every baby again develops as female because the double-Y babies die. If the Y-chromosome versions are different, a fourth of the babies will develop as YaYb males.
  3. The older males eventually die off, leaving only YaYb males. There are still XX females around from the last generation, but all of their offspring will now be XYa or XYb.
  4. The XX females eventually die off, leaving only XYa and XYb females.
  5. The temperature drops a bit further. Now YaYb embryos can develop as either male or female.
  6. Some YaYb females meet up with some YaYb males and the first clutch of eggs is laid that experiences a 50% chromosomal-induced fatality rate.
  7. The newt population has been experiencing a major catastrophe and has dropped to very small numbers. The X chromosome carrying females die out, due to either random chance or some minor benefit the YaYb females have.
Fig 6. Model for evolution of
new sex chromosomes.
At this stage in the story, there are no further X chromosomes and half of every clutch dies due to incompatible Y chromosomes. We shouldn't really call them Y chromosomes anymore, so lets call them chromosome 1s for simplicity. The population is now in a stable evolutionary configuration, but only for as long as the temperatures remain consistent.
  1. The temperature starts to rise back up and new 1a1b babies start developing as males. Some very few of the females happen to have a mutation on another chromosome (2*) that encourages female development. The offspring carrying this mutation develop female at these warmer temperatures.
  2. All the older females die off, leaving only those carrying the mutation. The temperatures are still rising and some newts carrying the mutation start developing male.
  3. Some males with the mutation meet up with females also carrying the mutation. The first newts with two copies of the mutation are born and develop female.
  4. The temperatures are still rising. Newts born with only one copy of the mutation start developing male. The only newts that develop female have two copies of the mutation.
  5. The older females die off, leaving only those with two copies of the mutation. The only new males are those born with one copy of the mutation. The older males die off, leaving only those with one copy of the mutation.
At this stage in the story, a new pair of sex chromosomes has evolved. The copy with the mutation is now an X chromosome and the copy without the mutation is now a Y chromosome. The residual chromosomes from the original sex chromosome pair are still causing 50% of babies to die in early development.


I could extend my model using a simulation-based approach similar to Grossen et al. to make a better comparison, but I don't expect I will. With complex evolutionary history like this, it might never be possible to ascertain exactly how the process unfolded. There could be many equally-probably historical scenarios that would have led to the evolution of the situation we see today. It's educational to study how these systems could potentially have evolved, even if we can't sort out the exact path they took to get where they now are.

I don't often write about published papers, but when I do I prefer to carry the discussion past where the paper ended. Discussing an alternate model is in no way an attack against the one proposed in Grossen et al.. It's an honest reflection of what I was thinking of while reading and is part of an exploration of the ideas discussed in the paper. Frankly, if their writing didn't give me any new ideas to play with, I wouldn't find it anywhere near as interesting to read. Good science answers a question. Great science answers a question and then draws you in to ask your own new questions.


This post was inspired by an interesting conversation over on Twitter. (You can follow me there as @thebiologistisn.)
The photos of the Triturus newts were loaned to me for this blog post by photographer (and newt wrangler) @Blackmudpuppy.


References:

Saturday, August 19, 2017

Significantly Fuzzy and Uncertain Math

I was always a very smart student, but I wasn't always a very good student. During lessons over the years, there would occasionally be little pieces that I would miss. Well, I either missed them or they simpler weren't taught. One of the earliest ones was about what the point of remainders were in doing division. I never once remembered a math teacher saying the remainder was the numerator and divisor was the denominator. When the schoolwork moved past remainders, I had to basically learn the math all over again because there was no apparent connection between what we were doing with what I had been taught before. Years later I was puzzling over what the point of that early math had been and I made the connection, filling in the gap in what I was taught. If someone is trying to teach me something and I can't integrate it into the knowledge I already have, it has always been extra difficult.

In high-school, I was taught about significant figures. Our pre-calculus teacher got in an argument with a student (not me) one day. She was adamant that, "0 was not the same as 0.000", but she didn't explain why. I always had the hardest time keeping the rules for significant figures straight during calculations. It was only in college that I finally understood that significant figures represent the level of uncertainty in a measurement. The idea that a numerical measurement was a distinct concept from the number that described the measurement was something of a novelty to me.


Those significant figures rules?
  1. For addition & subtraction, the last significant figure for the calculated results should be the leftmost position of the last significant figure of all the measured numbers. Only the position of the last significant figure matters. [10.0 + 1.234 ≈ 11.2]
  2. For multiplication & division, the significant figures for the calculated result should be the same as the measured number with the least significant figures. Only the number of significant figures matters. [1.234 × 2.0 ≈ 2.5]
  3. For a base 10 logarithm, the result should have the same number of significant figures as the starting number in scientific notation. [log10(3.000×10⁴) ≈ 4.4771]
  4. For an exponentiation, the result should have the same number of significant figures as the fractional part of the starting number in scientific notation. [10^2.07918 ≈ 120.0]
  5. Don't round to significant figures until the entire calculation is complete.


Lets see if we can convert these basic rules into something with a more statistical flavor. First we should define a way of writing uncertain numbers. lets define an example number 'x', which has a measured value of '2' and an uncertainty of ±1. If we consider the measurement to fit the Gaussian assumption, then that uncertainty would be the standard deviation.

x = (2±1)

If we add these two measurements together, with all their uncertainty, we'd expect an average value of 4 with some unknown standard deviation.

(2±1) + (2±1) = (4±[?])


Figure illustrating how arithmetic operations are performed on intervals. A=[-1,3], B=[1,5]. Top subfigure shows A+B=[0,8]. Bottom subfigure shows A-B=[-6,2].
[from link.]
We'll need to take a step back at this point. If you
If you go explore the topic of "fuzzy mathematics" on Wikipedia, you'll find some abstract discussion of set theory rather than something that seems like what we've been talking about here. If you do some searches for "fuzzy arithmetic", you'll get into a realm of math that is between the abstract set theory and something closer to what I'm looking for.

If you dig even further, you'll find Gaussian Fuzzy Numbers (GFN). This sounds very much like the sort of math I want. Two GFNs are added together to generate a new GFN in a two step process. The means of the two numbers are added to make the new mean. The standard deviations are added to make the new standard deviation. In the above notation, this would be:

(2±1) + (2±1) = (4±2)

This is a pretty straightforward rule, but it doesn't feel like it has the statistical flavor that I'm looking for.


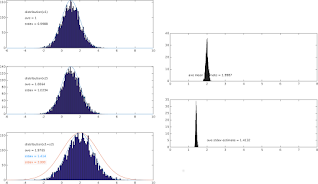
Figure illustrating a simulation of adding two normal/gaussian distributions. Top - and middle-left subfigures show randomized distributions with a mean and standard deviation of 1. Bottom-left subfigure shows the result of adding the two distributions together, a new distribution with a mean of 2 and a standard deviation of sqrt(2). At right are two subfigures showing estimates for the distribution mean and standard deviation from numerous simulation repeats.
Method 1
How can we derive the standard deviation produced by adding two uncertain measurements? After thinking about it a bit, I thought of two methods to estimate what the value would be.

My first method basically simulates two uncertain measurements. I created a set of several thousand random samples within each initial Gaussian distribution, then iterated every possible pairwise addition between the two sets. I then calculated mean and standard deviation estimates from the set of pairwise additions. I repeated this estimation process a few thousand times and calculated the average values for the mean and standard deviation. With enough repetitions of this process, the estimates began to converge.

(2±1) + (2±1) = (3.9998±1.4146) ≈ (4±sqrt(2))

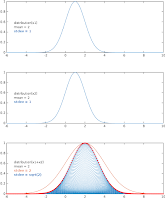
A figure showing an alternate method of deriving the result of adding together two gaussian distributions. Top and middle subfigure show a blue gaussian curve with a mean and standard deviation of 1. Bottom subfigure shows the result of adding every point from the first distribution/curve to every point of the second. The envelope, the upper bounds of the resulting set of points makes a new gaussian curve with a mean of 2 and a standard deviation of sqrt(2).
Method 2
That approach to estimating the new standard deviation takes a lot of calculations. My second method is much more efficient and converges faster. I started with two Gaussian curves, sampled at some high density. I then iterate through every combination of one point from first and second curves. For each combination, the two x-values were added to make a new x-value. The two y-values were multiplied to make a new y-value. (The y-values are probabilities. Multiplying the two probabilities calculates the probability for both happening at once.) Plot all those x/y value pairs (in light blue at left) and the envelope (or outline, roughly) of those points (shown in red) describes the same curve we calculated more roughly with my first method. I fitted the Gaussian distribution function to this curve to get the numerical estimate for it's standard deviation.

(1±1) + (1±1) = (2±1.4142) ≈ (2±sqrt(2))


Table from math textbook, showing specific calculations for addition/subtraction, multiplication, division, power, multiplication by a constant, and a generalized function of gaussians.
That seems a nice and simple relationship, but it is distinctly different than Gaussian Fuzzy Number calculation described previously would indicate. It took some further digging before I found a document on the topic of "propagation of uncertainties". The document included a nice table with a series of very useful relationships, describing how Gaussian uncertainties are combined by various different basic mathematical operations.

From these relationships, we can short-circuit around all the iterative calculations I've been playing with. If we have measurements with a non-Gaussian distribution, it might still be necessary to use the numerical estimation methods I came up with.


Figure illustrating addition of two gaussians by three different methods. Shows how significant figures calculations underestimates the expected resulting variation and how gaussian fuzzy number calculations over-estimate the expected resulting variation. Propagation of uncertainty calculations match the expectations from earlier simulation methods.
Lets compare the three methods for tracking uncertainty through calculations.

Significant figures: (1±0.5) + (1±0.5) = (2±0.5)
Gaussian fuzzy numbers: (1±0.5) + (1±0.5) = (2±1.0)
Propagation of uncertainties: (1±0.5) + (1±0.5) = (2±0.70711)

The significant figures method underestimates the uncertainty through the calculation, while the Gaussian fuzzy numbers approach overestimates the uncertainty. Both these methods do have the advantage of being simple to apply without requiring any detailed computation. However, the errors would probably accumulate through more extensive calculations. I'll have to play around with a few test cases later to illustrate this.


I didn't like significant figures when I was first taught about them. The rules struck me as somewhat arbitrary and the results didn't fit at all with my expectations of how numbers should behave. The lessons were always a stumbling point for me because of this disconnect.

Over the years since, I had occasionally played around with how to do it better. It was only recently that I figured out how to derive the solutions I described above and realized propagation of uncertainties was what I had been searching for. Those high-school lessons would have been so much more effective had they included the real math instead of assuming I couldn't handle the concepts.


References:

Tuesday, August 1, 2017

A Cross by Any Other Name

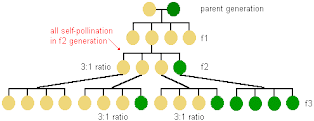
Figure illustrating how a recessive trait appears in F1, F2, and F3 generations after a cross. In F1, the trait is hidden. In F2, a quarter of individuals show the recessive trait. In F3, 3/16 of individuals show the recessive trait.
From [link].
I've been involved in a few discussions online lately about different types of crosses that can be used in plant breeding. There has been some mild confusion about basic terms, as well as about the implications of different types of crosses. A few years ago I wrote about backcrossing. Though that post is somewhat hard for me to read, as I imagine early writings are for most authors, it has some useful information. Here I'm going to try and do a more general overview. Lets see how this little ride goes.

Some of that basic terminology and common abbreviations:
  • P : Parental. An initial variety used in a cross. Multiple parents can be numbered, like in "p1 x p2".
  • F : Filial, relating to progeny generations after an initial cross. F1 is the initial hybrid. F2 is the result of crossing two F1s. F3 is the result of crossing two F2s, etc.
  • Self Cross : Crossing the male and female parts of the same plant.
  • BC : Back cross. Crossing a filial generation back to one of the parents.
  • CC : Complex cross. A cross involving more than two parents.

P : To simplify things, we usually use highly stable varieties as initial parents in a hybridization project. This means that several generations of each parent variety have been grown out without any visible variation appearing. At the basic genomic level, this means the varieties are highly homozygous. In theoretical cases we consider the parents to be absolutely homozygous, though reality is never quite so clear-cut.

F1 : Our initial hybrid between two parents can be written out in a bit longer form like "p1 x p2", or just referred to as an F1 between the two parents. In our idealized scenario, every F1 produced by crossing the same two parents will be identical. F1 stands for "first filial generation".

If a group of F1s aren't identical, this says one or both of the parents wasn't entirely homozygous. (Or new mutations were introduced, or epigenetic effects are at play, or etc. It can get complicated). Because they're (more or less) identical, selection usually isn't very important at this stage.

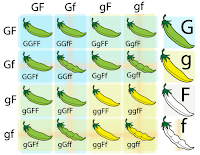
Figure showing Punnet square of a dihybrid cross in peas, with each potential offspring plant indicated by a cartoon of the resulting pea-pod. A quarter of potential plants have yellow pods. Independently, a quarter of potential plants show pinched pods, with seeds visible through the constricted pod surface.
From [link].
F2 : Our second filial generation is produced by crossing two F1s together. For those plants that can self cross (like peppers and tomatoes), the F2s would generally be produced by crossing one F1 to itself. For those that can't (like tomatillos), the F2s would be produced by crossing two separate F1 siblings.

The F2 generation is where the different alleles from each parent are recombined. Almost any combination of traits from each parent can turn up in an individual among the F2s. This is where the magic happens in a plant breeding project really happens. This generation is where selection is most important.

F3...Fn : Subsequent filial generations would be produced in a similar way to the F2s. If you produced F3s by selfing an F2, each F3 will have about 50% of the heterozygosity of the F2. Selfing another generation will result in another 50% loss of heterozygosity. Continue this process for enough generations and you will have a new stable variety, with an essentially homozygous genome.

If you produced F3s by crossing random F2s, you'll keep mixing up the genetics instead of automatically losing 50% of the heterozygosity each generation. If you do this with relatively few plants, you will still be losing heterozygosity each generation, though calculating exactly how much becomes a bit complicated.

If you produced F3s by crossing specific F2s that had a trait you liked, you'll keep mixing up all the other genetics while selecting for that specific trait. You would be losing heterozygosity near the genes responsible for the trait of interest, but the rest of the genome would still be maintaining heterozygosity through generations.

BC : In basic back crossing, each subsequent generation past F1 is crossed back to one of the parents. BC1 would be diagrammed something like, "[p1 x p2] x p1" (or "F1 x p1"). For one hypothetical mutation found in the first parent, a BC1 individual would have a 50% chance of having two copies (and a 0% chance of having no copies) since it is assured of inheriting one copy from the parental strain used in the backcross.

Through each generation of back-crossing the resulting plants will lose 50% of their heterozygosity, but it will be replaced with whatever mutations are found in the parental strain. The result will end up more and more like the recurrent parent strain over the generations. If you do this randomly, you will end up with essentially a genetic clone of the recurrent parent. To get anything different, you have to persistently select for a trait that was originally only in the second parental variety. Doing this will eventually produce something almost exactly like the recurrent parent, but with the one trait that was originally in the other parent variety. (That's all detailed in the link I mentioned in the intro.)

CC : A complex cross involves three or more parental varieties. A simple case would be taking an F1 and crossing it to an independent F1, "[p1 x p2] x [p3 x p4]". In these scenarios you would get a very diverse population, just like with F2s, but the mutations contributed to the population can come from all four parent varieties.

A mutation that was found in only one of the parental strains would only be found in one copy in 25% of this mixed up population. If one of these plants was selfed, the chance of a plant being homozygous in the next generation is 6.25%.
If the plants were allowed to cross randomly, the chance of a plant being homozygous in the next generation drops to only 1.5625%. You would need to be working with very large numbers of plants to routinely recover double-recessives using this strategy. I strongly advise you not use this strategy.


References:

Wednesday, July 19, 2017

Fences

For a while I kept up with the tempo of writing one blog post a week. Occasionally I'd pull ahead and have a few posts written and queued up to be automatically published. Occasionally I'd fall behind and go a few weeks between posts. I haven't been writing at all for a while now, since pretty much exactly when I started using Twitter. I post there as @thebiologistisn. (Twitter handles are limited to fifteen characters, so I had to make do.) I only have a certain amount of time in a day to play online and lately that hasn't been writing for the blog.

I've been accumulating ideas and half-baked concepts for posts, but I just haven't found the motivation to sit for the few to several hours it takes to write a full post. It doesn't help that my after-work time has been pretty full with house and yard tasks.


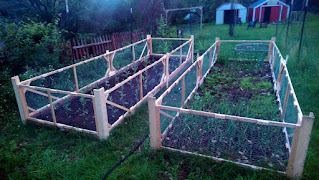
Two adjacent garden beds with short wood and chicken wire fences surrounding each.
Two years ago I built an effective deer fence. It kept them out and let me garden in peace. Last year our vegetable gardens were nearly wiped out by rabbits, that ran right through the deer-fence. They hadn't been an issue the year before, probably because we had a family of Cooper's Hawks in the yard to keep them under control. We had lots of rabbits around this year, so I couldn't plant anything they would eat until I had built some fences that would keep them out.

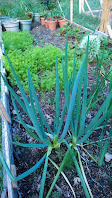
Two onion plants with a patch of carrots behind.
The garden at right got its fence done first. I then planted a nice patch of carrots and strawberries. The garden already had onions and siberian irises I'd planted the fall before. Rabbits don't like those, so those plants survived even without protection. The onions are potato onions I grew from seed. Two of the seedlings thrived (at left), while several others either died through the winter or didn't thrive this year. The carrots are all from breeding projects. The near half are the third generation plants and the far half are second generation plants.

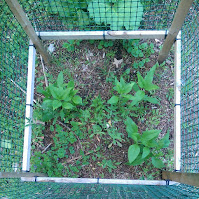
The rabbit fence for the second garden took a while longer to get built. It is now populated with a diverse collection of tomatoes from various breeding projects I'm working on. Theres also a small group of tomatilloes that I've been selecting for intense purple pigment. All these plants were put in the ground much later than would be ideal, so hopefully they will mature sufficiently to produce fruit this season. Next year I won't have to build fences, so things will get moving sooner.


One of the central rules I started this blog with was that I wouldn't write about my job. While I was in grad school, I didn't talk about my research. Since I've been out of grad school, I haven't talked about whatever work it is I'm doing now. This rule was intended to make it clear this blog is entirely my own and doesn't represent anyone else or any organization.

Now that I've got some more free time, there might just be blog posts coming at a slightly higher rate. Since I'm no longer in grad school, nor working in academia, I will probably start to have some posts about computational biology projects I've been working on. I might even have a few posts by guest bloggers. We shall see how this goes.

Friday, May 26, 2017

Return of the Sunflower

A few years ago I made a cross between a sunflower (var. "Russian Mammoth") and a sunchoke (probably var. "Stampede"). My goal was to eventually get a plant that produced tubers like the sunchoke, but was super-charged with the giant growth of the sunflower. The two species have different chromosome counts, which complicates things a bit.

Me standing with arm held upright above my head, next to sunflower plant in bloom where flower is another couple feet above my hand.
2014
That first cross resulted in three F1 plants. I should have grown more, but it didn't work out that way. One of the plants grew to 10ft tall, with relatively large flowers, while the other two looked more or less like the sunchoke parent. I moved by the end of this season, but I was able to go back and recover root material from the plants. I then stored the roots in a fridge over the first winter and planted them at our new place when spring came around. Only the tubers produced from the largest plant survived this process.

Our current place has routine visitations by deer who seem to find sunflower leaves delectable. The first several shoots produced by the tubers were neatly trimmed to the ground. When I finally put together some protection for them, they succeeded in sending up one final shoot. That shoot topped out at about 2ft tall and produced a single small flower. This was a far-cry from the 10ft skyscraper the tuber had come from. I was so disappointed that I didn't even take any pictures of the little plant. I assumed the repeated early-season trimmings had dwarfed it and hoped it would do better the following year.

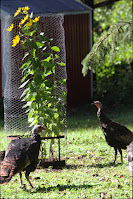
Small patch of tall upright sunflower plants inside a chicken wire cylinder, with two adult wild turkeys standing near.
2016
I was better prepared for 2016. I made a 7ft tall chicken-wire cylinder to place around the growing plant. This kept the plant protected for most of the season. The cylinder was knocked over a couple times (either by storms or aggressive deer), but this only exposed the lower leaves to the hungry mammals. The plant grew to about as tall as the cage and bloomed, still well short of the 10 ft of the first year. Though the plant branched much more than the first year, it did so much less than the sunchoke parent.

Our new yard has lots of animal traffic besides the deer. Turkeys are commonly seen in the neighborhood, though we don't often see them in our yard.


Three small sunflower plants starting to grow up from the soil, growing inside a wood and plastic mesh cage.
2017
I'm hoping the plant will do even better in 2017. Three clusters of new shoots have been coming up near where the plant was last year and I have a slightly wider protective cage put in place. The shoots are more widely spaced than they were last year. I'm hoping this means each individual stem will be larger/taller.

The plant produced abundant seeds in the first year, but has since then produced absolutely none. I'm pretty sure this means the plant inherited the self-incompatibility mechanism from its sunchoke mother. The first year there was plenty of pollen from its siblings, but there has been none the last couple of years.

There may be a few oilseed sunflowers around this year to contribute pollen, grown from scattered birdseed. My perennial sunflower is tetraploid, so any crosses to these diploids would produce highly sterile triploid offspring. These might be interesting to grow, but they wouldn't contribute to my overall goal.


For my breeding goals to move forward, I'll need to produce more tetraploid F1s by crossing sunchoke and another giant sunflower. I don't have any sunchoke planted right now, so I probably won't be able to get flowers even if I did find some tubers soon. There are several giant sunflower varieties I could use to help make more F1s, but I'll probably keep using "Russian Mammoth" to simplify the overall genetics of the future F2s.


References:

Sunday, May 21, 2017

Calculations in the Woods

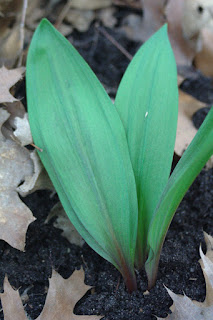
Cluster of three wide elongated leaves growing from woodland soil.
A. tricoccum in local woods.
Wild foods are available most times of the year in Minnesota, but one species that attracts the most interest in spring is Allium tricoccum (known as "Ramps" or "Wild Leeks"). This slow growing plant is a close relative of onions/chives that are routinely available and has a similar flavor, though aficionados will argue it has a flavor all of its own. Ramps are distinct from the commonly available onion types in that it grows broad and flat leaves, in addition to their habit of growing in the moist shade of wooded areas.

Over-harvesting of A. tricoccum has led to the species disappearing from many areas where they used to be common. The plants grow very slowly, taking several years to grow from seed to a mature plant. The plants are also sensitive to physical disruption because their fragile roots grow close to the surface. If all the plants in an area are pulled out (or accidentally killed), then it could be decades before some seeds find their way back and start towards reestablishing a population.

At this time of year, the local foraging groups are filled with people posting pictures of their (often outrageous) harvests as well as people responding with ideas about sustainable practices of harvest. Advice to, "take no more than half" or, "only take 10%" are pretty common. There doesn't seem to be any standard number. I think some mathematical analysis can maybe help clarify what might be a good rule.


[1] Lets start with a very simple model. We have a population of plants and a whole bunch of people interested in harvesting them.

If everyone harvests 1/2 of the plants...

\(\lim \limits_{n\to\infty} \frac{1}{2}^n = 0\)

...or 1/4 of the plants (thus 3/4 remain after each person harvests)...

\(\lim \limits_{n\to\infty} \frac{3}{4}^n = 0\)

...then the population still dwindles towards extinction.

In this simplified model it doesn't matter what fraction each person takes, the population will always dwindle away towards extinction. This isn't realistic, since we didn't factor in the ability of the plants to reproduce.


[2] A slightly more complicated (and realistic) model factors in how fast the plant is able to replicate itself. Lets assume a fraction of of the adult plants are able to produce another adult plant each year. This is still a pretty big simplifying (and highly optimistic, since it is quite biologically wrong) assumption, but it's a starting point to work from. Lets start by defining some terms.

\(\begin{array}{cl}
R_y & \text{Population of Ramps in year 'y'.} \\
r_i & \text{Total increase rate per year.} \\
r_h & \text{Total harvest rate per year.} \\
\end{array}\)

The population of next year is calculated from the current year population and the total rate of increase.

\(R_y(1+r_i) = R_{y+1} \)

Then we add in a term for losses due to people harvesting a percentage of the plants.

\(R_y(1+r_i)(1-r_h) = R_{y+1} \)

If we want the population to remain stable over time...

\(R_y = R_{y+1} \)

\(R_y(1+r_i)(1-r_h) = R_{y+1} \)
\((1+r_i)(1-r_h) = \frac{R_{y+1}}{R_y} \)
\((1+r_i)(1-r_h) = 1 \)
\(1-r_h = \frac{1}{1+r_i} \)
\(r_h = 1-\frac{1}{1+r_i} \)

...and we assume a third of the plants produce a second plant each year,

\(r_i = \frac{1}{3}\)

\(r_h = 1-\frac{1}{1+\frac{1}{3}} \)
\(r_h = 1-\frac{1}{\frac{4}{3}} \)
\(r_h = 1-\frac{3}{4} \)
\(r_h = \frac{1}{4} \)

...then a cumulative total of 25% of the plants could be harvested each year. If any more were harvested, then the population would be declining like in our first model.

Remember, this is the cumulative total harvest rate. This could be just one person harvesting Ramps, or it could be several people harvesting separately through the season. If two or more people come across the patch and decide to harvest some, then they would have to harvest less than the 25% we calculated and still have the population remain stable. We have to define some new terms...

\(\begin{array}{cl}
n & \text{Number of people harvesting in a year.} \\
r_{hi} & \text{Harvest rate per individual per year.} \\
\end{array}\)

The relationship between the number of individuals harvesting and the cumulative total harvest rate is pretty simple.

\((1-r_{hi})^n = (1-r_h) \)

\(\begin{array}{c|c}
{n} & {r_{hi} = 1-\sqrt[n]{\frac{3}{4}}} \\
\hline \\
{1} & {r_{hi} = 1-\frac{3}{4}} = 0.25 \\
{2} & {r_{hi} = 1-\sqrt{\frac{3}{4}}} \approx 0.13397 \\
{3} & {r_{hi} = 1-\sqrt[3]{\frac{3}{4}}} \approx 0.09144 \\
{4} & {r_{hi} = 1-\sqrt[4]{\frac{3}{4}}} \approx 0.06940 \\
{5} & {r_{hi} = 1-\sqrt[5]{\frac{3}{4}}} \approx 0.05591 \\
{\vdots} & {\vdots} \\
{10} & {r_{hi} = 1-\sqrt[10]{\frac{3}{4}}} \approx 0.02836 \\
{\vdots} & {\vdots} \\
{100} & {r_{hi} = 1-\sqrt[100]{\frac{3}{4}}} \approx 0.00287 \\
\end{array}\)

The main lesson we can take from this second model is the more people that have access to a patch of Ramps, the smaller the fraction each person can harvest for the population to remain sustainable.


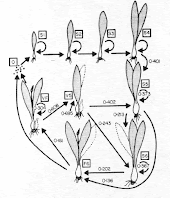
Figure illustrating how Ramp plants increase in size over years.
From link.

[3] Mathematically, a more ideal model would be somewhere between the discrete series function I used above and a set of continuous differential equations expressing the same concepts as well as accounting for stochasticity in the rates. Biologically, a more ideal model would include each life stage shown in the figure at right (encompassing sexual and vegetative reproduction) as well as realistic rates for each step.

It would be a relatively simple task to construct this sort of more detailed model, but properly determining all the rates would require extensive (presumably years-long) fieldwork. Thus, I'll leave this as an exercise for the reader.


Even though the models we discussed here are incomplete, they are informative. The big lesson is that the harvesting of Ramps from publicly accessible places is a nice example of a tragedy of the commons. There really isn't a harvesting percentage that can be used as a rule of thumb to tell people in the various forums.

If you have a large patch on your own land, then you can probably harvest a decent amount each year and the patch will never be at risk. Our hypothetical model [3] above might be able to tell us precisely how much of a population could be sustainably harvested, but without all the additional information it isn't worth worrying over. You can simply pay attention to how much you harvest and notice if the patch is dwindling or not from year to year. As it is your own patch, which you find valuable, you will adjust your personal harvest rate to allow the patch to prosper.

Is there anything we can encourage foragers to do, aside from simply advising them to leave the plants alone? If you harvest only one leaf from each mature plant (never the last leaf, or from small plants), without disturbing the bulb and roots, then the plants will survive and spread each year. If everyone followed this rule, large patches of Ramps could be maintained in woodlands close to or even within large cities. Convincing people to do this will be a difficult task.


References:

Tuesday, April 4, 2017

Pepper Permutations

Whenever I interact with a plant breeder, I first want to know what their goals are with their projects. Then I want to know about how they're approaching the problem and what results they've had so far. There are other interesting conversations to be had with breeders (What got you started in plant breeding? What got you interested in this crop? etc.), but these are the ones I keep asking when a breeder mentions their projects.

I've got a few pepper breeding projects I'm working on. I figured I'd answer my own questions regarding them, though I may ramble on a bit.


Bell pepper plants with small green pods held upright above the plant. At upper-right, a couple of the pods are ripening to a brown color.
Upright fruit on plant from 2nd generation.
Upper-right: Overlay of fruit ripening brown.
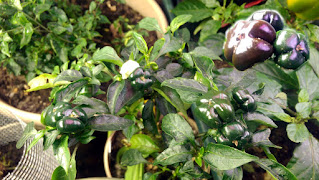
My first pepper breeding project started with a simple observation. I was growing a batch of plants from seed I had saved from a tasty small brown bell pepper I found at the grocer. One of the plants had fruit which pointed upwards. I decided I liked the look of the plant, so it was to only one I saved seed from.

The next year, I grew several plants and only found 2 of the 7 had the upright fruit posture I liked. I was disappointed, but this told be something important about the genetics of the trait. Since the female parent had the trait, but not all of the kids did, the trait didn't have a dominant inheritance. This is consistent with the description of the trait in a review of published research, indicating there are two recessive genes that interact to produce the trait.

At the end of the last growing season, I dug up the plants for this project and moved them into my basement under lights. This lets me ensure the next batch of seeds will only be from selfing the selected plants. This should help ensure the next generation of plants will all have the upright fruit trait.

This project was pretty simple to plan and is moving forward nicely. I'm hoping the plants I grow out this year will show the project is essentially complete. 


I have other projects that aren't so simple, in that they will require one or more directed hybridizations. These projects will take several years to accomplish, that is if I ever complete them.

What are my breeding goals?
  1. White Habanero: A Habanero with very little of any pigment, so appear "white".
  2. Black Habanero: A Habanero with high levels of anthocyanins, so appear "black".
  3. Fancy Jalapeno: A Jalapeno which ripens to red with brown stripes; bonus points for having dark purple marks too when ripe.
  4. Floral peppers: Arbitrary fruit, with large and colorful flowers. Ideally with flowers presented above leaves.
How am I approaching these goals?
  1. White Habanero: A review of the
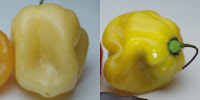
    Two habanero pepper pods. At left a cream color. At right a bright yellow color.
    [+;c1;+] and [y;+;c2]
    primary color genes for peppers (in an earlier post) indicates I can get a "white" chile with the genotype [y/y;c1/c1;c2/c2]. I have pale-orange (genotype [+/+;c1/c1;+/+]) and yellow (genotype [y/y;+/+;c2/c2]) habanero varieties. They both have the shape I'm looking for, so it is just the color genes I'll have to worry about. The F1 formed by crossing the two strains will be red and have the genotype [+/y;+/c1;+/c2]. Among the F2s, 1/64 should be homozygous for all three recessive traits needed to make a "white" chile.
    • All the other red/orange/yellow colors should also turn up in the F2s, so this will be an interesting cross to play with.
    • There is a variety called "White Habanero", but it doesn't have the shape I think of when I think of a Habanero pepper.
    • I've even thought of a name for the final variety: "Pale Horse".
    A narrow black pepper pod.
    [A;MoA;an]
  2. Black Habanero: I already have a "black" chile called "Pimenta da Neyde" (genotype [A;MoA;an]). It doesn't have the habanero shape, but I can cross it to a habanero for those traits. The boxy shape is dominant to the elongated shape, so the F1 should be boxy (and have some arbitrary color). Among the F2s, 1/64 should be homozygous for the three recessive traits needed to make the "black" color. 3/4s should have the boxy habanero shape, with 1/3 of those being homozygous for the dominant trait. All together, 1/192 of the F2s should have the ideal combination of traits.
    1. Depending on what color genes are hidden beneath the black of "Pimenta da Neyde", as well as what traits are brought to the party by the habanero, lots of other colors are likely to turn up in the F2s.
    2. There is also a variety called "Black Habanero", but it has neither the black color or the shape I'm looking for.
    3. I've also thought of a name for the final variety: "Black Death".
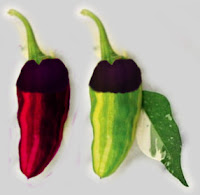
  3. Fancy Jalapeno: his concept will
    Artistic rendering of a pair of pepper pods with black top and green/yellow or red/orange striped bottom.
    Hypothetical ripe and immature.
    take combining traits from several varieties. "Fish" has a recessive striped trait. I have a nice Jalapeno with a black top when unripe (which is probably related to sun exposure). I have a bell pepper which ripens brown because the chlorophyll isn't degraded upon ripening. "Pimenta da Neyde" has the trait to retain anthocyanin when the fruit is ripe. Getting all these traits, due to at least 6 different genes, into one plant is going to be a challenge. My plan so far is to make crosses between two pairs of the four strains. Once I've selected F2s from each cross that have their parents' traits, I'll then cross them, then select among the new F2s.
    1. I don't yet have a name in mind to go with this project.
    2. I may give up before this project is done. We shall see.
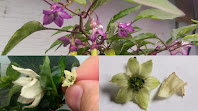
    Three photos of pepper plant flowers. Flowers at top are dark purple. At bottom show a large pepper flower held next to a tiny pepper flower.
    Floral variations.
  4. Floral Peppers: I have a bell pepper line with very large, white flowers. I have a pepper with relatively large intense-magenta flowers. I also have a pepper with relatively tiny, but greenish-yellow flowers. The plan is to cross each of the two colored-flower chiles to the bell pepper, then screen the resulting F2s for larger flowers with improved color. The fruit characteristics are entirely arbitrary.
What have I accomplished towards these goals?
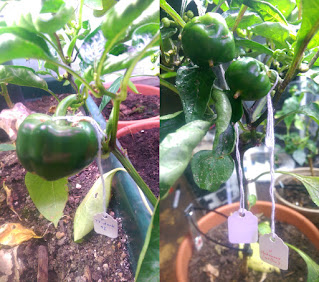
  1. Two bell pepper plants with green unripe pods with small paper tags hanging from them.
    Left: Chile with magenta flowers crossed to bell.
    Right: Chile with greenish flowers crossed to bell.
    White Habanero: I have a mature habanero plant with yellow fruit. I am about to plant seeds for the one pale-orange fruit. Later in the season I'll be able to do the initial cross.
  2. Black Habanero: I have a mature habanero. I have several plants of "Pimenta da Neyde", but they're all very slow growers and have yet to flower. Hopefully later in the season I'll be able to do the initial cross with them.
  3. Fancy Jalapeno: I have got basically nothing done towards this goal. I have all the seeds and will be planting them shortly.
  4. Floral Peppers: I've made each of the initial crosses between the chiles with colored flowers and the bell pepper with extra-large white flowers.


It took me a while to figure out what sort of peppers I might want to breed. I've got a few other projects in mind, but I figured this post was getting rather long already.

It helps to keep an open mind when working on breeding projects, since you will find variations and combinations of traits that you didn't expect from the outset. So long as you're doing the breeding project for your own purposes (as I am), there is no harm in changing direction along the way. I expect the F2s from the habanero crossed to the bell pepper to be all sorts of interesting. Even if my ideas about floral peppers never comes to fruition, something useful will come out of it.

Among pepper plants I've grown, I've already found a couple really interesting traits that have caused me to change course. I'm not willing to discuss them publicly yet. I'm still trying to decide if they're the sort of thing that would have value to a larger market, so to speak.


References:

Thursday, February 23, 2017

Biology of the Enjoya Pepper

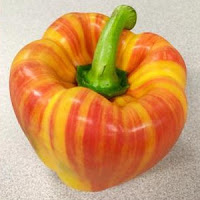
Large bell pepper from grocery store, colored in red and yellow vertical stripes.
"Enjoya" pepper; marketing
photo from the TwitterVerse.
A few years ago a new pepper turned up in markets of Europe and then in the USA (and elsewhere). The bell peppers were a dramatic yellow splashed with red flames and were sold as "Enjoya" or "Flame" peppers.

There was no information available about the genetics of the trait, as there had been no academic literature published on the new variety. Gardeners with the habit of growing their own plants from seed took this as a challenge. People around the globe independently said, "Can I can grow seeds from that pepper and get striped fruit in my garden?" Seeds were collected by those who found the peppers in their grocers and then shared via online forums to those who had not yet found them. Soon after, there were many little green seedlings being tended to around the world.
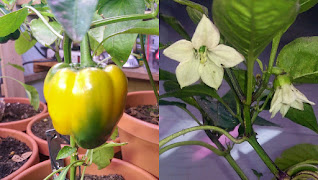
At left a bell pepper hanging on the plant, ripening yellow. At right a couple large white pepper flowers.
Typical flowers and fruit.

Months later, the first reports on the plants started coming in. The plants were producing large bell peppers, but they were all ripening yellow. (I have reports of 11 plants maturing to produce yellow fruit.) As these reports were posted to the forums, interest in the plants waned. (Dreams of crossing the trait into jalapenos and other hot peppers quietly died.) If the amazing red flames weren't going to reappear, then why would anyone want to be growing these plants?


Where did these peppers come from?

The marketing site for the pepper says:
Now, 30 years later, nature has once again surprised us with a natural variation: the red/yellow striped pepper. In 2013, Wilfred van den Berg found this beautiful variety in his greenhouse in Est.
But the US patent applied for the pepper says:
[0011] `E20B3751` was discovered in a screening trial of mutants of pepper variety `Maduro` conducted at Est, Netherlands. The mutant `E20B3751` was selected based on its vertical red and yellow stripes color and propagated vegetatively (i.e., asexually).
I strongly suspect those responsible for writing the marketing site didn't want to say the variety was the result of a mutation breeding project in a high-tech lab, as such things tend to get a lot of people suspicious about their foods. This is only a slight fib, since the mutated variety is a variation of the natural pepper.

What draws my attention more is that the patent doesn't say anything at all about how the pepper plant was produced (aside from the general concept of a mutagenesis screen). The entirety of the patent starting on line [0046] is simply a rehashing of general plant biology and breeding. None of that tells us anything at all about the origin of the striped peppers. This is strongly counter to the basic idea of what patents are supposed to be. The earlier paragraphs of the patent do give a concise description of what the pepper is, as well as a listing of specific traits associated with it, so it isn't entirely a useless document.


Since there isn't any academic research published on the pepper and neither the patent or marketing information provide any biological details, we're going to have to see what we can figure out from basic principles.

Mutations in genes typically produce traits which are either dominant or recessive. (There are a few other scenarios, but we're not going to worry about them for now.) If the striped trait is recessive, then essentially all of the next generation would also have the trait.

If the striped trait was dominant, then [with perfect selfing] the next generation might all have the trait, but there are other scenarios. If the Enjoya pepper plant (remember, from the patent they are propagated assexually and so are all from the same genetic plant) was heterozygous for the dominant trait, then half of the next generation would remain heterozygous and have the trait. Another quarter would be homozygous for the no-stripes trait and the remaining plants would be homozygous for the striped trait. Dominant traits can sometimes also have recessive lethal characteristic, though it is rare. All together, at the very least 66.6% of the next generation should have stripes if the trait was due to a dominant nuclear mutation.

In either scenario, we should have the majority of the next generation with stripes. What do we see? Between my plants and those reported by other growers, we have 16 plants that have ripened fruit. All of which matured to yellow with no red stripes. This would be a very unexpected result for either model discussed above.


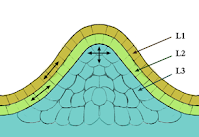
A diagram illustrating three tissue layers in a plant meristem.
Meristem figure from Wikipedia.
There is another scenario that might be important. A growing meristem of a plant include multiple tissue layers which replicate independently. A mutation in one layer generally won't transfer to the other layers. As the plant grows, the mutated and non-mutated tissues will be maintained separately. As leaves or other organs develop, the different meristem layers contribute to different parts and so would result in visible variegation if the mutation had a visible impact.

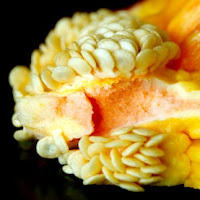
Inside of a bell pepper, showing seeds growing from yellow tissue, with reddish tissue deeper beneath the seeds.
Photo cropped from one at link.
After looking around a bit, I found a photo which might provide some clarity to the situation. In the cropped close-up at right, it is clear that all the seeds are attached directly to yellow tissue. There is red tissue in the core of the seed mass, but none at the surface where the eggs (and then seeds) developed.

It looks like some of the red core cells are able to migrate to the surface of the fruit during early development. This results in the red stripes as the fruit then expands in size.

Since the red color is carried in tissue which isn't made into eggs or seeds, it appears unlikely that the seed-grown progeny of an Enjoya pepper would produce red or striped fruit.

Sorry folks, I think the game is up. We probably won't be able to breed flame-colored jalapenos. At least we've learned something about the biology of these peppers.


That the striped trait can't be passed down through seeds tells us something about the experiments which led to the Enjoya pepper. The patent indicates it came from a mutagenesis experiment, but gives no details. One of the easiest ways to do it would have been to soak a large batch of seeds in a chemical mutagen (like EMS) and then grow them out after treatment. EMS is relatively easy to work with and it would produce point mutations all over the nuclear and cytoplasmic genomes. I bet when that first plant matured its first fruit, there were amazed expressions all around.

The classical story of pepper color genetics (described at the-biologist-is-in.blogspot.ca/2015/11/the-color-of-peppers-2.html) suggests it would take two separate mutations to produce the rich yellow color seen in the Enjoya pepper. However, there are a lot of mutations which impact pepper color that don't really seem to fit the classical story. I strongly suspect the visible difference between the red and yellow fruit tissues is down to one mutation.

However, EMS is not something that would be used to make a single point mutation. It would instead create hundreds or thousands of point mutations per seed in this sort of mutagenesis experiment. Selection of the resulting progeny, as well as backcrossing to the parent type, would normally be used to clean up any unwanted deletarious mutations... but the striped trait would not have survived this process.

This means that the genome of the Enjoya pepper is probably chock-full of other potentially interesting mutations. Many of those mutations will be recessive and so only become visible in the second generation after treatment. The plants we've been growing from saved seed represent that second generation (referred to in shorthand as M2).

A large bell pepper at two stages of maturity. At right, early on it has black pigment at the top of the pod. At right, later, the top of the pod is turning yellow.
Enjoya-M2 with a transient anthocyanin shoulder.
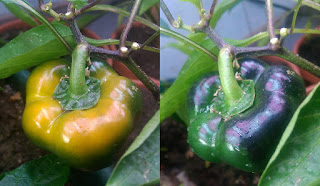
One of my seven M2 plants produced a dark shoulder of anthocyanin pigments on the unripe fruit. These anthocyanins were later broken down as the fruit matured to its [now] expected yellow. Dark shoulders are pretty common in peppers, so I'm still trying to decide if I want to save any seeds from this plant.

A large bell pepper on the plant, showing faint stripes in shades of green. At right is a pepper flower in white, with a purple spot on each petal.
Enjoya-M2 with color-marked flowers.
Interesting stripes on the unripe fruit.
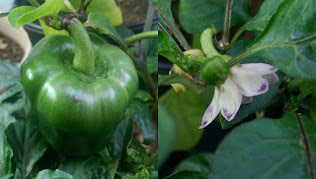
Another of my seven plants produced flowers with distinctive purple highlights. The fruit on this plant later showed a distinctive green striping on the shoulder while unripe. (The fruit of every other plant was solidly dark green.) I'm still expecting this one to mature to a solid yellow, but there remains the slim chance that a red cell fought its way into the seed. (The pepper has since ripened to the expected yellow.)

Two of my seven plants produced distinctively different plants. This suggests there are indeed numerous hidden recessive mutations in the Enjoya pepper. The relatively large fruit I've been getting from these plants and the potential to find other novelty mutations means I'll probably be growing quite a few of these M2 plants in the coming years.


References: