// Twitter Cards // Prexisting Head The Biologist Is In: February 2020

Friday, February 21, 2020

Photoshop again.

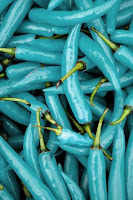
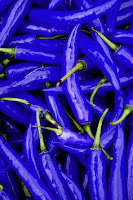
Online seed vendors vary dramatically from the largely respectable, to the folks selling "peppers" like those below that I found on the Amazon or Ebay marketplaces.

To you, the botanically savvy purchaser, these vendors stand out as clearly fraudulent. But not everyone is botanically savvy. People who don't instantly know these wonderful colored peppers are just photoshopped versions of a red pepper photo are such vendors intended "customers".

Pile of cayenne peppers photo edited to look cyan in color. Pile of cayenne peppers photo edited to look blue in color. Pile of cayenne peppers photo edited to look purple in color. Pile of cayenne peppers photo edited to look magenta in color. Pile of cayenne peppers; original photo the others here were modified from.


Even among the largely respectable vendors, there are a wide range of philosophical or political stances that may impact your decisions of who to buy from. Does the company support white supremacists? Do they sell patented plant varieties? Do they push pseudo-science in their catalogs?

It can take some digging to be certain you agree with the politics behind any given company. It can take significant effort to bring such considerations into your buying decisions, so I understand if you choose not to do so.

But please, don't buy seeds from vendors selling off-hue peppers, blue strawberries, rainbow roses, rainbow onions, or the many other scams that are out there. If something looks too good to be true, at the very least investigate further. These online vendors rely on people clicking "buy" when seeing something interesting. By the time you've grown up the seeds and realize you were scammed, the time to contest the purchase in the marketplaces the vendors work through will have long since expired.

Friday, February 14, 2020

Tomatillo Breeding (4/n)

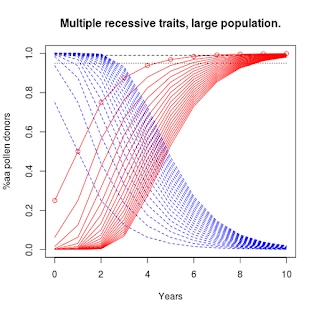
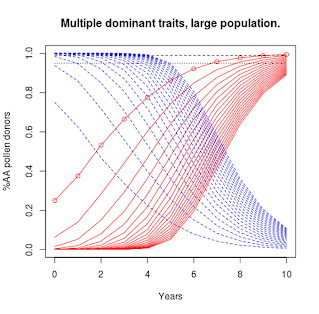
The last couple posts have looked at simulations for selection of a single gene, for recessive or dominant alleles. Increasing the number of genes actively under selection results in it taking longer and longer for the population to converge.
Plot titled "Multiple recessive traits, large population", illustrating selection for a trait in an out-crossing population.
Plot titled "Multiple dominant traits, large population", illustrating selection for a trait in an out-crossing population. It takes more years for the trait of interest to reach saturation in the population.
The change in code to simulate multiple genetic loci is really simple if we assume the different alleles we're selecting on are found sufficiently distant from each other on the chromosomes. This is referred to as "un-linked" and means the probability calculations for each are independent of the others.

R Script 5: Multiple recessive traits, large population.
# One recessive trait, infinite population.
#     Stabilize progeny for recessive trait via selection.
#     Save seeds from double-recessive plants each generation.
years <- 10;

# Define F2 population.
P_AA <- vector();
P_Aa <- vector();
P_aa <- vector();
P_AA <- 0.25;
P_Aa <- 0.50;
P_aa <- 0.25;

# Save seeds only from aabb plants, unknown pollen donor. Iterate over years.
for(i in 1:years) {
  P_AA <- append(P_AA,   0);
  P_Aa <- append(P_Aa,   P_aa[i]*P_AA[i]*1.00 + P_aa[i]*P_Aa[i]*0.50);
  P_aa <- append(P_aa,   P_aa[i]*P_aa[i]*1.00 + P_aa[i]*P_Aa[i]*0.50);
  P_sum <- P_aa[i+1] + P_Aa[i+1];
  P_Aa[i+1] <- P_Aa[i+1]/P_sum;
  P_aa[i+1] <- P_aa[i+1]/P_sum;
}

# Make figure.
plot(  0:years, P_aa^1, col="red", main="Multiple recessive traits, large population.", xlab="Years", ylab="%aa pollen donors", xlim=c(0,years), ylim=c(0,1), axes=TRUE, frame.plot=TRUE);
lines(0:years, P_aa^1, col="red");
lines(0:years, 1-P_aa^1, col="blue", lty="dashed");
lines(c(0,years),c(0.95,0.95), col="black", lty="dotted");
lines(c(0,years),c(0.99,0.99), col="black", lty="dashed");

for(i in 2:20) {
  lines(0:years, P_aa^i, col="red");
  lines(0:years, 1-P_aa^i, col="blue", lty="dashed");
}

R Script 6: Multiple dominant traits, large population.
# One dominant trait, infinite population.
#     Stabilize progeny for dominant trait via selection.
#     Save seeds from dominant plants each generation.
years <- 10;

# Define F2 population.
P_AA <- vector();
P_Aa <- vector();
P_aa <- vector();
P_AA <- 0.25;
P_Aa <- 0.50;
P_aa <- 0.25;

# Save seeds only from (AA and Aa) plants, unknown pollen donor. Iterate over years.
for(i in 1:years) {
  P_AA <- append(P_AA,   P_AA[i]*P_AA[i]*1.00 + P_AA[i]*P_Aa[i]*0.50 + P_Aa[i]*P_Aa[i]*0.25);
  P_Aa <- append(P_Aa,   P_AA[i]*P_aa[i]*1.00 + P_AA[i]*P_Aa[i]*0.50 + P_Aa[i]*P_aa[i]*0.50 + P_Aa[i]*P_Aa[i]*0.50);
  P_aa <- append(P_aa,   0);
  
  P_sum <- P_AA[i+1] + P_Aa[i+1];
  P_AA[i+1] <- P_AA[i+1]/P_sum;
  P_Aa[i+1] <- P_Aa[i+1]/P_sum;
}

# Make figure.
plot(  0:years, P_AA, col="red", main="Multiple dominant traits, large population.", xlab="Years", ylab="%AA pollen donors", xlim=c(0,years), ylim=c(0,1), axes=TRUE, frame.plot=TRUE);
lines(0:years, P_AA, col="red");
lines(0:years, 1-P_AA, col="blue", lty="dashed");
lines(c(0,years),c(0.95,0.95), col="black", lty="dotted");
lines(c(0,years),c(0.99,0.99), col="black", lty="dashed");

for(i in 2:20) {
  lines(0:years, P_AA^i, col="red");
  lines(0:years, 1-P_AA^i, col="blue", lty="dashed");
}


The probability of an F2 plant having two copies of recessive alleles for multiple genes drops to minimal very quickly when we increase the number of genes. In a small population this low probability means we might not find an F2 with all the recessive alleles stacked up the way we might want. All is not lost.

With our small F2 population, roughly a quarter would be expected to be in the double-recessive condition for the first gene of interest.

25% AA; 50% Aa; 25% aa

If we were unlucky and couldn't find a single plant that was also double-recessive for the second gene of interest, we can go ahead with plants showing the dominant trait for that second gene. The probability is that two thirds of the plants showing the dominant trait for the second gene will be heterozygous, carrying one copy of the recessive allele.

aaB_ (⅓BB; ⅔Bb)

In the next generation we have pretty good odds of recovering that second recessive trait that we were looking for. This way we can progressively collect multiple recessive traits without finding them in that first F2 generation. With this strategy, we need to keep seeds from prior generations. If we can't recover that next recessive trait in the next year, then we managed to find plants that were not heterozygous for the gene of interest. We need to grow more plants from the previous generation again, to try and find some carrying a copy of the recessive allele.


With plants that typically self-pollinate (like peppers and tomatoes), it can be pretty simple to intentionally remove recessive alleles for genes of interest. If you grow out the seeds produced by a plant and find any double-recessive progeny, you know that plant was heterozygous. If you don't find any double-recessive progeny, if you grow enough seeds, you can be pretty confident of that plant being homozygous for the dominant allele.

With plants that can't self-pollinate (like tomatillos), it can take more work/time. Lets say we have one plant that is showing the dominant trait. If we cross it with a plant showing the recessive trait, the resulting progeny will tell us if that first plant is "AA" or "Aa". If all the progeny show the dominant trait, then the plant we were testing is "AA". If the progeny show a mix of dominant and recessive traits, then the plant we were testing is "Aa" (and can be discarded). This is called a "test-cross" because it is used to test the genetics of a specific individual, even though we have no interest in using the progeny that result for further breeding work.

Since tomatilloes can be kept alive over several years, you can use such test crosses to progressively collect multiple plants with just the dominant alleles for your genes of interest. Once you have a few such plants, you can then allow them to inter-cross and be confident you won't have the recessive allele turning up in the next generations.

Friday, February 7, 2020

Tomatillo Breeding (3/n)

I've been doing some math to help me think about breeding strategies with tomatillos. Last week I showed some code for calculating how populations of different sizes converge under selection for a single recessive trait. Here I'll show similar code for a single dominant trait.
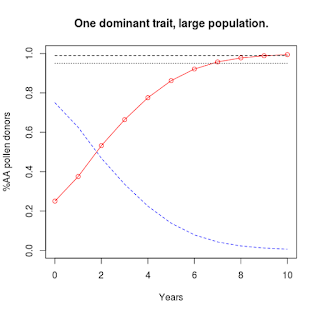


X-axis, years going from 0 to 10. Y-axis, "%AA pollen donors" going from 0 to 1. Red curve for %AA goes from lower left, rises slowly towards 1, and then smooths out to approach 1. Blue curve descends in a mirror image.
Solid red curve with circles: %AA pollen donors.
Dashed blue curve: %Aa & %aa pollen donors.
Like before, we'll start with an infinite population.

Since we can't tell the difference between plants with one or two copies of the dominant trait ("AA" or "Aa"), we can't tell what the genetic status is of any one plant that we save seeds from. Our goal is a population entirely consisting of "AA" plants, so that is what the code will plot.

The zero year is our F2 population. It takes seven years for the "AA" individuals to represent 95% (dotted horizontal line) of the population. Three years later the level crosses above 99% (dashed horizontal line) of the population.

Because this is the infinite population scenario, there will always be a small percentage of the population carrying the recessive allele.

R Script 3: One dominant trait, infinite population.
# One dominant trait, infinite population.
#     Stabilize progeny for dominant trait via selection.
#     Save seeds from dominant plants each generation.
years <- 10;

# Define F2 population.
P_AA <- vector();
P_Aa <- vector();
P_aa <- vector();
P_AA <- 0.25;
P_Aa <- 0.50;
P_aa <- 0.25;

# Save seeds only from (AA and Aa) plants, unknown pollen donor. Iterate over years.
for(i in 1:years) {
  P_AA <- append(P_AA,   P_AA[i]*P_AA[i]*1.00 + P_AA[i]*P_Aa[i]*0.50 + P_Aa[i]*P_Aa[i]*0.25);
  P_Aa <- append(P_Aa,   P_AA[i]*P_aa[i]*1.00 + P_AA[i]*P_Aa[i]*0.50 + P_Aa[i]*P_aa[i]*0.50 + P_Aa[i]*P_Aa[i]*0.50);
  P_aa <- append(P_aa,   0);
  
  P_sum <- P_AA[i+1] + P_Aa[i+1];
  P_AA[i+1] <- P_AA[i+1]/P_sum;
  P_Aa[i+1] <- P_Aa[i+1]/P_sum;
}

# Make figure.
plot(  0:years, P_AA, col="red", main="One dominant trait, large population.", xlab="Years", ylab="%AA pollen donors", xlim=c(0,years), ylim=c(0,1), axes=TRUE, frame.plot=TRUE);
lines(0:years, P_AA, col="red");
lines(0:years, P_Aa+P_aa, col="blue", lty="dashed");
lines(c(0,years),c(0.95,0.95), col="black", lty="dotted");
lines(c(0,years),c(0.99,0.99), col="black", lty="dashed")
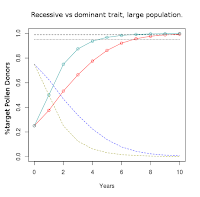
X-axis, years going from 0 to 10. Y-axis, "%target Pollen Donors" going from 0 to 1. Cyan curve for recessive percentage goes from lower left, rises sharply towards 1, and then smooths out to approach 1. Red curve for dominant percentage goes from lower left, rises slowly towards 1, and then smooths out to approach 1. Yellow curve descends in a mirror image of cyan curve. Blue curve descends in a mirror image of red curve.
Cyan line w/circles: recessive selection.
Red line w/circles: dominant selection.
To compare the trajectory for selection on the recessive allele vs on the dominant allele, I overlaid the two curves in an image editor. I inverted the colors for the recessive curves to better distinguish them from the added dominant curves.

Selection on a dominant trait progresses at a slower rate initially than selection on a recessive trait, but by about ten years the two approaches would be expected to reach a similar degree of completeness.

With smaller population sizes, we'd expect the selected allele (dominant or recessive) to reach complete saturation by about that time point.


With recessive traits, I only had to consider "aa" plants as seed producers. With dominant traits, I have to consider "AA" and "Aa" plants. This seems like a small difference, but for simulating small numbers this adds significant complexity.
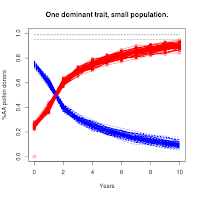
Similar to above figure, but each curve is replaced by a tight cluster of overlapping curves representing individual runs of the simulation.
Population = 1000
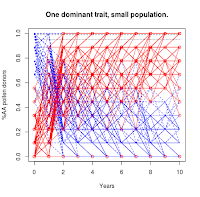
Similar to above figure, but each curve is replaced by a very loose cluster of overlapping curves representing individual runs of the simulation.
Population = 50
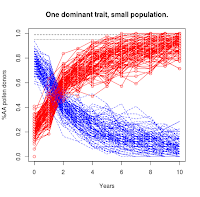
Similar to above figure, but each curve is replaced by an extremely loose cluster of overlapping curves representing individual runs of the simulation. These curves occupy almost the entire figure.
Population = 10

If you compare these plots to those for the recessive selection scenario (https://the-biologist-is-in.blogspot.com/2020/01/tomatillo-breeding-2n.html), you'll see that this scenario has a much higher level of noise in the trajectories. For the smallest population level, it takes 30 years (not shown in figures) for the majority of the experimental replicates to converge on the targeted "AA" condition.

R Script 4: One dominant trait, small population.
# One dominant trait, small population.
#     Stabilize progeny for dominant trait via selection.
#     Save seeds from dominant plants each generation.
years <- 10;
population <- 1000; # 1000, 50, 10
trials <- 100;

# Intialize figure.
plot( c(0,years),c(0,years), col="red", main="One dominant trait, small population.", xlab="Years", ylab="%AA pollen donors", xlim=c(0,years), ylim=c(0,1), axes=TRUE, frame.plot=TRUE);
lines(c(0,years),c(0.95,0.95), col="black", lty="dotted");
lines(c(0,years),c(0.99,0.99), col="black", lty="dashed");

for (ii in 1:trials) {
  # Define F2 population probabilities for selection on AA plants.
  P_AA_1 <- vector();
  P_Aa_1 <- vector();
  P_aa_1 <- vector();
  P_AA_1 <- 0.25;
  P_Aa_1 <- 0.50;
  P_aa_1 <- 0.25;
  
  # Define F2 population probabilities for selection on Aa plants.
  P_AA_2 <- vector();
  P_Aa_2 <- vector();
  P_aa_2 <- vector();
  P_AA_2 <- 0.25;
  P_Aa_2 <- 0.50;
  P_aa_2 <- 0.25;

  # Save seeds only from (AA and Aa) plants, which can't self-polinate.
  for (i in 1:(years+2)) {
    # Generate actual population.
    rands <- runif(population, 0, 1);
    Genotypes <- vector();
    for (j in 1:population) {
      if (rands[j] < P_AA_1[i]) {
        Genotypes <- append(Genotypes, "AA");
      } else if (rands[j] < P_AA_1[i]+P_Aa_1[i]) {
        Genotypes <- append(Genotypes, "Aa");
      } else {
        Genotypes <- append(Genotypes, "aa");
      }
    }
    Genotype_counts <- table(Genotypes);
    
    # Determine actual genotype probabilities for pollen donors. (Assuming "AA" plant in case 1, "Aa" plant in case 2.)
    if (is.na(Genotype_counts["AA"])) {
      P_AA_1[i] <- 0;
      P_AA_2[i] <- 0;
    } else {
      P_AA_1[i] <- (Genotype_counts["AA"]-1)/(population-1); # The plant we're saving seeds from can't be polinated by itself.
      P_AA_2[i] <- Genotype_counts["AA"]/(population-1);
    }
    if (is.na(Genotype_counts["Aa"])) {
      P_Aa_1[i] <- 0;
      P_Aa_2[i] <- 0;
    } else {
      P_Aa_1[i] <- Genotype_counts["Aa"]/(population-1);
      P_Aa_2[i] <- (Genotype_counts["AA"]-1)/(population-1); # The plant we're saving seeds from can't be polinated by itself.
    }
    if (is.na(Genotype_counts["aa"])) {
      P_aa_1[i] <- 0;
      P_aa_2[i] <- 0;
    } else {
      P_aa_1[i] <- Genotype_counts["aa"]/(population-1);
      P_aa_2[i] <- Genotype_counts["aa"]/(population-1);
    }
  
    # Generate new theoretical genotype probabilities.
    P_AA_1 <- append(P_AA_1,   P_AA_1[i]*P_AA_1[i]*1.00 + P_AA_1[i]*P_Aa_1[i]*0.50 + P_Aa_1[i]*P_Aa_1[i]*0.25);
    P_Aa_1 <- append(P_Aa_1,   P_AA_1[i]*P_aa_1[i]*1.00 + P_AA_1[i]*P_Aa_1[i]*0.50 + P_Aa_1[i]*P_aa_1[i]*0.50 + P_Aa_1[i]*P_Aa_1[i]*0.50);
    P_aa_1 <- append(P_aa_1,   0);
    
    P_AA_2 <- append(P_AA_2,   P_AA_2[i]*P_AA_2[i]*1.00 + P_AA_2[i]*P_Aa_2[i]*0.50 + P_Aa_2[i]*P_Aa_2[i]*0.25);
    P_Aa_2 <- append(P_Aa_2,   P_AA_2[i]*P_aa_2[i]*1.00 + P_AA_2[i]*P_Aa_2[i]*0.50 + P_Aa_2[i]*P_aa_2[i]*0.50 + P_Aa_2[i]*P_Aa_2[i]*0.50);
    P_aa_2 <- append(P_aa_2,   0);

    P_sum_1 <- P_AA_1[i+1] + P_Aa_1[i+1];
    P_AA_1[i+1] <- P_AA_1[i+1]/P_sum_1;
    P_Aa_1[i+1] <- P_Aa_1[i+1]/P_sum_1;
    
    P_sum_2 <- P_AA_2[i+1] + P_Aa_2[i+1];
    P_AA_2[i+1] <- P_AA_2[i+1]/P_sum_2;
    P_Aa_2[i+1] <- P_Aa_2[i+1]/P_sum_2;
    
    # Weighted average of the two probability sets by proportion of "AA" vs "Aa" plants.
    #  Only _1 values carry over to next iteration.
    if (is.na(Genotype_counts["AA"])) {
      count_AA <- 0; } else {
      count_AA <- Genotype_counts["AA"];
    }
    if (is.na(Genotype_counts["Aa"])) {
      count_Aa <- 0; } else {
      count_Aa <- Genotype_counts["Aa"];
    }
    weight1 <- count_AA/(count_AA+count_Aa);
    weight2 <- 1-weight1;
    val_AA_1 <- P_AA_1[i+1];
    val_AA_2 <- P_AA_2[i+1];
    val_Aa_1 <- P_Aa_1[i+1];
    val_Aa_2 <- P_Aa_2[i+1];
    P_AA_1[i+1] <- val_AA_1*weight1 + val_AA_2*weight2;
    P_Aa_1[i+1] <- val_Aa_1*weight1 + val_Aa_2*weight2;
    
    if (is.na(P_AA_1[i+1]) == TRUE) {  P_AA_1[i+1] <- 0;  }
    if (is.na(P_Aa_1[i+1]) == TRUE) {  P_Aa_1[i+1] <- 0;  }
    
    if ((P_AA_1[i+1]+P_Aa_1[i+1]) == 0) {
      # End simulation cycle if no "AA" or "Aa" plants.
      for (j in (length(P_aa_1)):years) {
        P_AA_1 <- append(P_AA_1,   0);
        P_Aa_1 <- append(P_Aa_1,   0);
        P_aa_1 <- append(P_aa_1,   0);
      }
      break;
    }
    
    ## Debugging output.
    #message("Iteration ", i);
    #print(Genotypes);
    #message("  ");
  }

  # Add current simulation cycle to figure.
  points(0:years, P_AA_1[1:(years+1)], col="red");
  lines( 0:years, P_AA_1[1:(years+1)], col="red");
  lines( 0:years, 1-P_AA_1[1:(years+1)], col="blue", lty="dashed");
}


This essentially means it isn't possible to selectively breed a dominant trait to complete saturation in a small population just using simple selection.

Unlike in the recessive case, we can't just save a few plants over winter to reset the population with only the exact genetics we want. A similar strategy should allow for more rapid progress towards the goal, however.

I'll explore this topic further next time.